All work
RShinyMachine LearningData Visualization
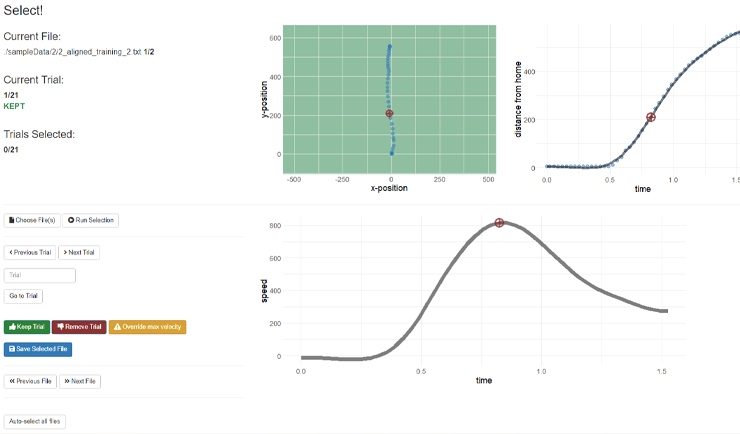
Visualization of Reach Trajectories
An interactive R/Shiny tool for visualizing and clustering movement trajectories from motor learning experiments.
Overview
This is an R Shiny application for visualizing reach trajectory data collected in the lab. Raw movement data from motor learning experiments can be dense and high-dimensional — this tool makes it interactive and interpretable.
Features
- Trajectory plotting — render individual or averaged reach paths across participants and conditions
- Data transformations — rotate, normalize, and align trajectories to a common reference frame
- Time-point labeling — annotate specific events within a movement (e.g., peak velocity, endpoint)
- Clustering — optional unsupervised clustering to identify distinct movement strategy subgroups across trials
The clustering approach was particularly useful for separating participants who showed explicit re-aiming from those relying on implicit sensorimotor adaptation — a key distinction in visuomotor learning research.